Economics on the Series 65 Exam
Economics questions test your understanding of how the economy works and how economic conditions affect investment decisions.
- 15% of the exam (approximately 20 questions) covers economic factors
- 6 questions specifically on basic economic concepts
- Topics include business cycles, Fed policy, indicators, and yield curves
Investment advisers must understand economic fundamentals to give appropriate advice. After passing the Series 65, you’ll apply these concepts daily. A client’s investment strategy should adapt to economic conditions. Knowing whether the economy is expanding or contracting, what the Fed is doing, and where we are in the business cycle all influence suitability recommendations.
This section is more conceptual than calculation-heavy. Focus on understanding the relationships between economic factors rather than memorizing specific numbers. Our flashcard strategies guide explains how to use active recall and spaced repetition for conceptual learning. Not just rote memorization. Which is ideal for economics questions.
Business Cycle Phases
The business cycle describes the natural expansion and contraction of economic activity over time. The economy moves through four distinct phases, and understanding where we are in the cycle helps guide investment decisions. Practice identifying business cycle phases with our basic economic concepts questions.
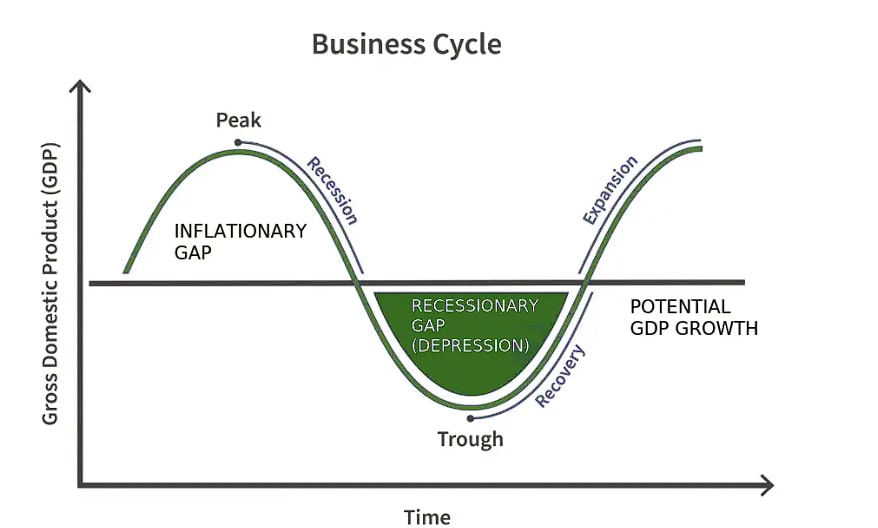
Expansion
Economic activity is growing. GDP rises, businesses expand.
- Rising corporate profits
- Increasing employment
- Higher consumer spending
- Rising stock prices
- Increasing wages and savings
Typical investments: Growth stocks, equities, cyclical sectors
Peak
Maximum economic output. Growth cannot continue; downturn begins.
- GDP at highest level
- Full employment
- Rising inflation concerns
- Fed may raise rates
- Market optimism often high
Typical investments: Defensive stocks, reduce cyclical exposure
Contraction
Economic decline. GDP falls, unemployment rises.
- Falling corporate profits
- Rising unemployment
- Declining stock market
- Rising inventories
- Reduced consumer spending
Typical investments: Bonds, defensive sectors, cash
Trough
Lowest point. Economy bottoms out before recovery.
- GDP at lowest level
- Highest unemployment
- Wages and savings bottom
- Fed implements stimulus
- Opportunity for value investing
Typical investments: Position for recovery, value stocks
Key Definitions
Federal Reserve Tools
The Federal Reserve (the Fed) is the central bank of the United States. It uses three primary tools to implement monetary policy and influence economic conditions. Understanding these tools is essential for the Series 65.
1. Open Market Operations (Most Used Tool)
The Fed buys and sells government securities (Treasury securities) in the open market.
To Loosen (Expand) Money Supply: Fed buys securities from banks
- Banks receive cash for securities
- More money available to lend
- Interest rates decrease
- Stimulates economic activity
To Tighten (Contract) Money Supply: Fed sells securities to banks
- Banks pay cash for securities
- Less money available to lend
- Interest rates increase
- Slows economic activity
2. Discount Rate (Direct Rate Control)
The discount rate is the interest rate the Fed charges banks that borrow directly from it through the discount window.
To Loosen Money Supply: Fed lowers the discount rate
- Banks can borrow cheaper
- Banks lower their rates
- More borrowing and spending
To Tighten Money Supply: Fed raises the discount rate
- Banks pay more to borrow
- Banks raise their rates
- Less borrowing and spending
3. Reserve Requirements (Least Used Tool)
Reserve requirements are the percentage of deposits that banks must hold in reserve (cannot lend out).
To Loosen Money Supply: Fed lowers reserve requirements
- Banks can lend more deposits
- More money enters system
- Interest rates decrease
To Tighten Money Supply: Fed raises reserve requirements
- Banks must hold more in reserve
- Less money available to lend
- Interest rates increase
Ready to practice what you just learned about monetary policy?
- Basic Economic Concepts Questions (6 questions)
These questions cover Fed tools, monetary vs fiscal policy, and business cycle applications.
The federal funds rate is the rate banks charge each other for overnight loans. The Fed does not set this rate directly but influences it through open market operations. When the Fed announces a rate change, it is targeting the federal funds rate.
The three Fed tools and their effects are high-frequency exam topics that benefit from spaced repetition study. Our flashcard strategies guide explains how FSRS-powered flashcards can help you distinguish between expansionary and contractionary actions for each tool. A common exam question pattern.
Master Fed Policy & Business Cycles
CertFuel tracks your accuracy on all three Fed tools and four business cycle phases separately. Our Smart Study algorithm prioritizes the economic relationships you're weakest on, whether that's distinguishing expansionary from contractionary policy or remembering which indicators are leading vs. Lagging.
Access Free BetaMonetary vs. Fiscal Policy
Two types of policies influence the economy. Understanding who controls each and how they work differently is commonly tested on the Series 65.
Monetary Policy
Controlled by the Federal ReserveInfluences the economy through the money supply and interest rates.
Tools:
- Open market operations
- Discount rate
- Reserve requirements
Expansionary (Loose):
Increase money supply, lower rates to stimulate growth
Contractionary (Tight):
Decrease money supply, raise rates to slow inflation
Fiscal Policy
Controlled by Congress and the PresidentInfluences the economy through government spending and taxation (fiscal policy).
Tools:
- Government spending programs
- Tax rates and incentives
- Transfer payments
Expansionary:
Increase spending, lower taxes to stimulate growth
Contractionary:
Decrease spending, raise taxes to slow inflation
Monetary = Money = Fed (Federal Reserve controls money supply)
Fiscal = Government = Congress (Government controls spending and taxes)
Economic Indicators
Economic indicators are statistics that provide information about the economy’s health and direction. They are classified by when they change relative to the overall economy.
Leading Indicators
Change before the economy changes direction. Used to predict future economic conditions.
Examples:
- New building permits
- Stock market (S&P 500)
- Initial unemployment claims
- New orders for durable goods
- Average weekly manufacturing hours
- Consumer confidence surveys
Use: Anticipate economic turning points
Coincident Indicators
Change at the same time as the economy. Show current economic conditions.
Examples:
- GDP (Gross Domestic Product)
- Industrial production
- Personal income
- Retail sales
- Non-farm payrolls (unemployment rate)
Use: Confirm current economic state
Lagging Indicators
Change after the economy has changed direction. Used to confirm economic trends.
Examples:
- Unemployment duration
- Prime rate
- Inventory levels
- Corporate profits
- Consumer price index (CPI)
- Labor cost per unit of output
Use: Confirm trend direction and sustainability
Inventory levels are a lagging indicator, not leading. A buildup in inventories occurs after demand has already fallen. Do not confuse this with new orders for durable goods, which is a leading indicator.
Lagging indicators change after the economy has changed direction. Practice distinguishing all three types with our basic economic concepts questions.
Confusing leading and lagging indicators is just one of many economics-related traps on the Series 65. Our common mistakes guide identifies all top exam failure patterns, including economic concept confusions that trip up even well-prepared candidates, or practice analytical methods questions for calculation-based concepts.
Yield Curves
A yield curve plots the interest rates of similar bonds (typically Treasury securities) with different maturity dates. The shape of the yield curve provides insight into future economic expectations.
Normal (Upward-Sloping)
Signal: Healthy Economy
Long-term rates are higher than short-term rates.
- Most common shape
- Reflects economic growth expectations
- Investors demand higher yields for longer commitments
- Indicates stable, expanding economy
Flat
Signal: Economic Uncertainty
Short-term and long-term rates are similar.
- Transition period indicator
- Market uncertainty about Fed direction
- Often precedes curve shift
- Investors may prefer shorter maturities
Inverted (Downward-Sloping)
Signal: Recession Warning
Short-term rates are higher than long-term rates.
- Rare but significant
- Every U.S. Recession since 1970 was preceded by an inverted curve
- Typically 12-18 months before recession
- Investors expect rates to fall (economic slowdown)
The yield curve’s shape reflects market expectations about future interest rates and economic conditions. An inverted yield curve is one of the most reliable recession predictors in economic analysis.
Test your understanding with types of risk questions covering yield curve interpretation.
Inflation & Deflation
Inflation and deflation represent changes in the general price level of goods and services. The Fed attempts to maintain price stability, targeting around 2% annual inflation.
Inflation
Rising general price levels; purchasing power decreases.
Causes:
- Demand-pull: Too much money chasing too few goods
- Cost-push: Rising production costs passed to consumers
Fed Response:
Contractionary policy to slow the economy:
- Sell securities (reduce money supply)
- Raise discount rate
- Raise reserve requirements
Investment Impact:
- Fixed-income purchasing power erodes
- Real assets (real estate, commodities) may benefit
- TIPS provide inflation protection
Deflation
Falling general price levels; purchasing power increases.
Causes:
- Decreased demand for goods and services
- Excess productive capacity
- Often accompanies severe recessions
Fed Response:
Expansionary policy to stimulate the economy:
- Buy securities (increase money supply)
- Lower discount rate
- Lower reserve requirements
Investment Impact:
- Cash and fixed-income gain purchasing power
- Debt becomes more expensive in real terms
- Stock valuations typically decline
Key Inflation Measures
| Measure | What It Tracks | Notes |
|---|---|---|
| CPI | Consumer price changes (basket of goods) | Most widely reported; used for COLA adjustments |
| PPI | Producer/wholesale price changes | Leading indicator of consumer inflation |
| PCE | Personal consumption expenditures | Fed’s preferred measure; broader than CPI |
| GDP Deflator | Price changes across entire economy | Broadest measure; includes all GDP components |
Series 65 Exam Tips: Economics
Economics questions focus on understanding relationships and concepts rather than complex calculations. Here is how to approach them:
High-Priority Concepts
- Business cycle phases: Know characteristics of expansion, peak, contraction, trough
- Fed tools: Open market operations (most used), discount rate, reserve requirements
- Policy types: Monetary (Fed) vs. Fiscal (Congress); expansionary vs. Contractionary
- Indicators: Leading predict, coincident confirm, lagging verify
- Yield curves: Normal = healthy, inverted = recession warning
Common Exam Questions
Fed Actions
“If the Fed wants to stimulate the economy, which action would it take?”
Answer pattern: Look for buying securities, lowering rates, reducing reserve requirements
Indicator Classification
“Which of the following is a leading economic indicator?”
Answer pattern: Building permits, stock market, unemployment claims = leading; inventory levels, unemployment duration = lagging
Yield Curve Interpretation
“An inverted yield curve typically indicates…”
Answer pattern: Potential recession, expectations of lower future rates
The 20 economics questions on your exam come from these four subtopics:
- Basic Economic Concepts Questions (6 questions)
- Types of Risk Questions (6 questions)
- Financial Reporting Questions (4 questions)
- Analytical Methods Questions (4 questions)
Master these foundations to build confidence for the harder sections.
Memory Aids
- Fed BUYS to BOOST: Fed buys securities → banks have more money → rates fall → economy expands
- Fed SELLS to SLOW: Fed sells securities → banks have less money → rates rise → economy contracts
- Leading = Look ahead: These indicators help you see what is coming
- Lagging = Look back: These confirm what has already happened
These memory aids and exam tips are most effective when integrated into a structured study plan. Our study schedule guide shows how to allocate daily study time across all four exam sections, including economics, to ensure comprehensive preparation without cramming.
Economics questions ultimately test whether you understand how economic conditions affect investment decisions. During expansion, growth investments thrive. During contraction, defensive positions and bonds become more appropriate. Always connect economic concepts to practical investment implications.
For more exam preparation, explore our math and formulas guide, review investment products, or start practicing with our economic concepts questions.